
What do you do?
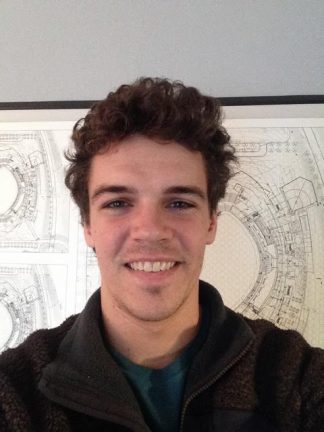
How I Work: Ethan Young
I am a Ph.D. student in the Department of Psychology. On a broad conceptual level, I like to think that I ask interesting questions and find innovative ways to answer those questions.
Specifically, I study how early life environments influence the mind to affect cognitive abilities and other behaviors in the adulthood. Basically, I study how childhood experiences influence the way people react and behave as adults.
When I first started my graduate career, I was excited to do the good work of a young social scientist. Unfortunately, I was quickly disenchanted at how easily bogged down research can get with disorganized files, poorly documented data, and haphazard workflows.
I can’t tell you how many times I tried to reorganize my files or set my computer up in different ways to reflect the “optimal” workflow for my research. On top of these issues, collaboration just compounds all these problems, especially when workflows clash. I’ve spent A LOT of time learning how to be more efficient, prevent redoing my work, and make my workflow easier to engage with.
What tools/software/hardware/etc. do you use to do your work?
My day-to-day consists of designing clever experiments in Qualtrics (which is awesome survey design and experimental studies) and running those experiments on unassuming undergraduates. I also work with already collected longitudinal data. In a nutshell, I work with data all the time. More specifically, I work with a lot of really “messy” data.
By messy data I mean data that is not ready to be analyzed right away. Enter R and Rstudio. R is a statistical programming language and Rstudio is an IDE (Integrated Development Environment). I also work a handful of particular R packages (little compact, self-contained sets of functions that do stuff) that are dedicated to making messy data clean and turning any impossible data problem into feasible one, no matter how irrevocably messy the data.
These packages are from Hadly Whickam’s tidyverse, and they work seamlessly together to read data from any source/file format, clean and wrangle, manipulate, transform, plot, and communicate your results. What I love about these packages is that the code is intuitive to write and easy to understand. They are designed to be human readable and their underlying philosophy is based on literate programming, don’t repeat yourself (DRY), writing functions, and making your data analysis as reproducible as possible (learn way more about this by reading this book R for Data Science).
One of the greatest advantages of using R and Rstudio with packages from the tidyverse is that you can make your entire research process reproducible. I use these packages in conjunction with Rmarkdown to write reproducible documents. Reproducible documents are documents that contain bits of R-code (chunks) that execute the functions you used to analyze your data intermixed with normal text that explains either the code or your project broadly. You can then create tables and plots or even report statistics in prose in the rest of your document.
Rmarkdown will execute the results of your code and embed them in the document wherever you specify. This allows you to dynamically analyze and create your report, manuscript, or presentation, which means you can update your analysis with new data or filter out problem observations and recalculate, re-tabulate, and redraw all your plots, tables, and stats that you report in your document. There are lots of great examples on the web so I would encourage you to take a look if you are interested. I’ve written entire manuscripts in Rstudio, the beauty is that if your colleagues ask you to reanalyze your data with new parameters, you can very quickly, without any copying and pasting. Pretty slick.
What do you use that you love? What do you use that you wish worked better?
Obviously I love R, Rstudio, and Rmarkdown. I particularly love the R packages ggplot2, dplyr, stringr, tidyr, haven, and diagrammeR. All of these packages make my research happen in one place in order to maximize flow and reproducibility.
The one problem that I continuously run in to is collaboration. No one that I work with uses R or even knows what a reproducible document looks like. If I want to collaborate on a manuscript, I can create a reproducible word document using Rmarkdown. However, the moment my advisor starts editing my writing using tracked changes, the reproducibility of the document is lost. This is because there is no way to get the changes my advisor makes back in to Rstudio, where all the code and therefore reproducibility happens.
Ideally, my collaborators would help me write my manuscripts in Rstudio but they are easily scared away by code and wouldn’t know what to do. I’m hopeful that some astute developers out there will come up with better collaboration tools for these situations but right now they don’t exist.
Note from the librarian:
Amy Riegelman
Ethan stressed his commitment to reproducibility. Check out the reproducible research services offered by the University Libraries, LATIS, and the the Minnesota Super Computing Institute. As Ethan mentioned, research could get bogged down with disorganized files, poorly documented data, and haphazard workflows. University of Minnesota – Liberal Arts Technologies and Innovation Services (LATIS) created a video to help address these issues- Strategies for Preventing Research Workflow Breakdown – Amy Riegelman